RAMIS:Increasing Robustness and Accuracy in Medical Image Segmentation with Hybrid CNN-Transformer Synergy
Jia Gu, Fangzheng Tian, IlSeok Oh
Abstract
Hybrid architectures based on Convolutional Neural Networks (CNN) and Vision Transformer (ViT) have become an important research direction in medical image segmentation in recent years. However, the currently popular hybrid architectures weaken the decision making process within the transformer model, and the upsampling of convolution stacking is difficult to restore the blurred boundaries of the target area. To improve the feature learning capability by addressing these issues, we propose RAMIS, a novel hybrid architecture for general medical image segmentation. RAMIS develops implicit neural representation and self-distillation to simultaneously obtain the super-resolution details and core features of the image as input to the Transformer encoder. Meanwhile, RAMIS explores an unsupervised learning CNN to obtain the initial input to the Transformer decoder, which not only explicitly considers the correlation within different samples, reduces the constraints on small datasets, but also fully leverages the potential of Transformer’s cross-attention for optimizing segmentation results. RAMIS designs a multi-resolution interaction network to post-process the Transformer output and solves the problem of blurred segmentation boundaries by combining super-resolution image. We extensively evaluate RAMIS on five datasets from three typical publicly available medical image segmentation datasets. Extensive experimental results demonstrate the general applicability and superior performance of the proposed method.
For easy viewing of details. Click on the image in this section to make it full screen. In full-screen mode, you can use the mouse wheel to zoom in on the image and drag the mouse to view the details. Press 'Esc' to exit full screen mode.
(1) RAMIS prediction results
We show more prediction results of the proposed method on three different datasets in this section.
[1/3]
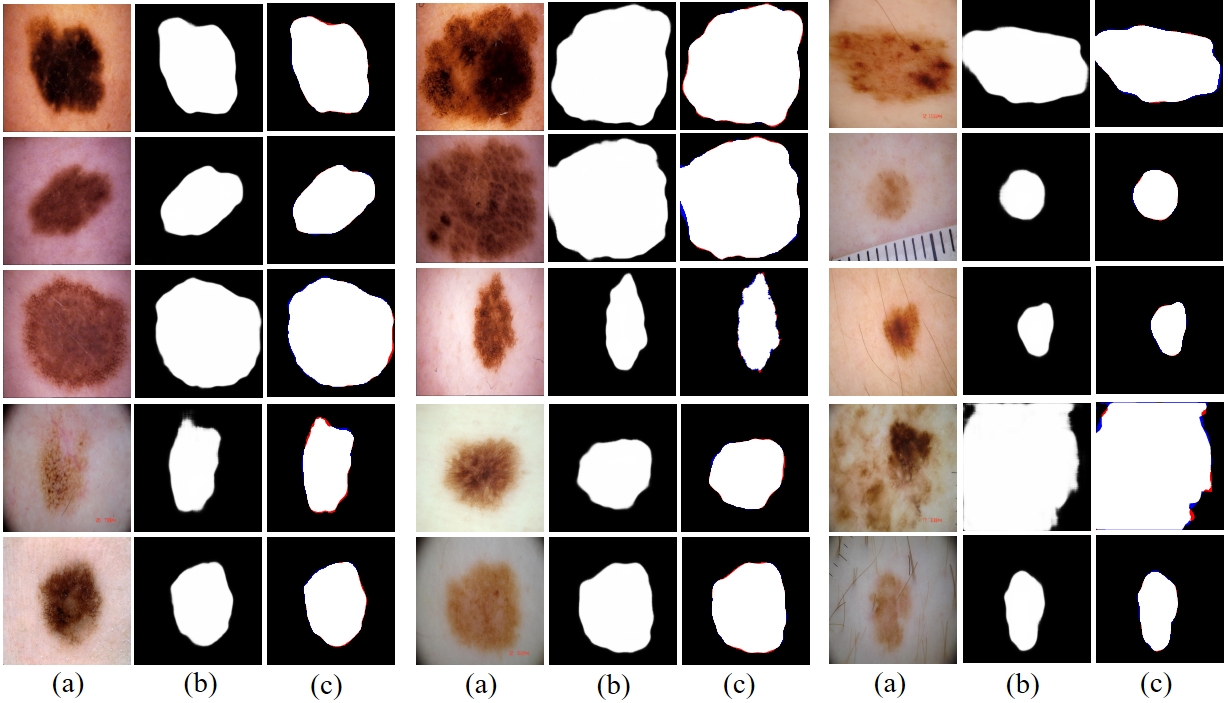
Fig. 1 Prediction results of RAMIS on skin cancer lesion dataset. (a) represents the input image. (b) is the predicted result. (c) is the comparison result between the prediction result and Ground Truth, where red indicates false negatives and blue indicates false positives.
[2/3]
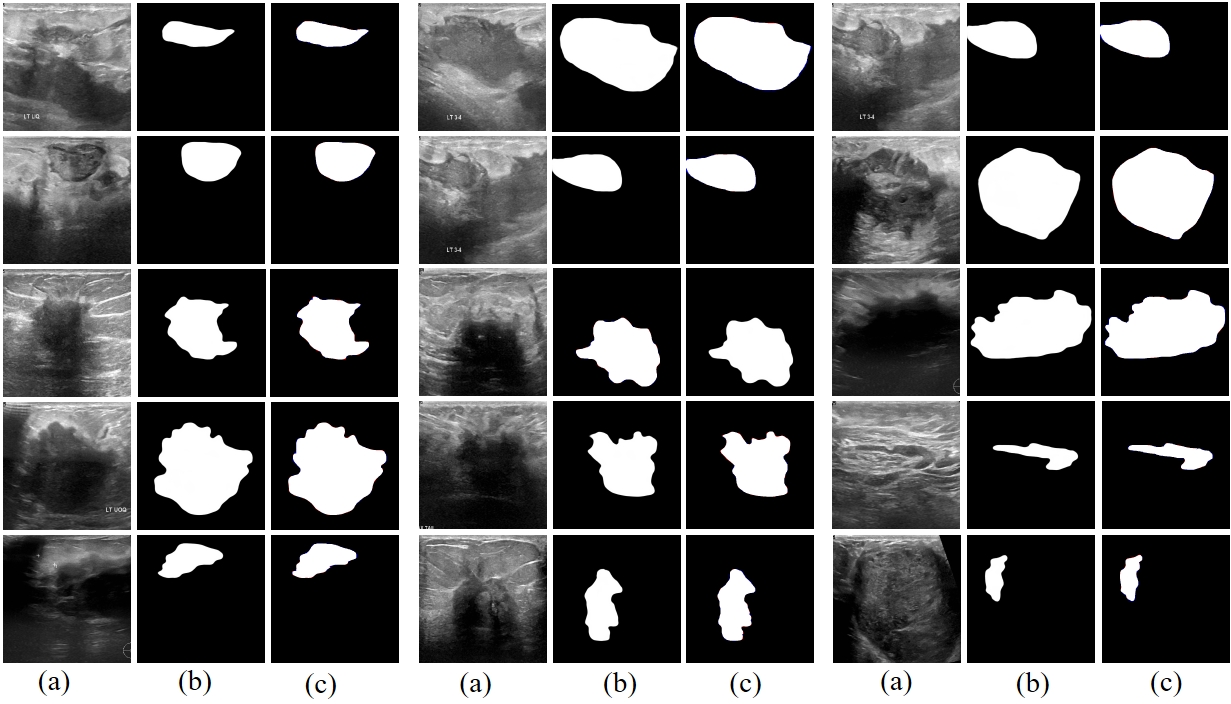
Fig. 2 Prediction results of RAMIS in breast tumor ultrasound image segmentation dataset. (a) represents the input image. (b) is the predicted result. (c) is the comparison result between the prediction result and Ground Truth, where red indicates false negatives and blue indicates false positives.
[3/3]
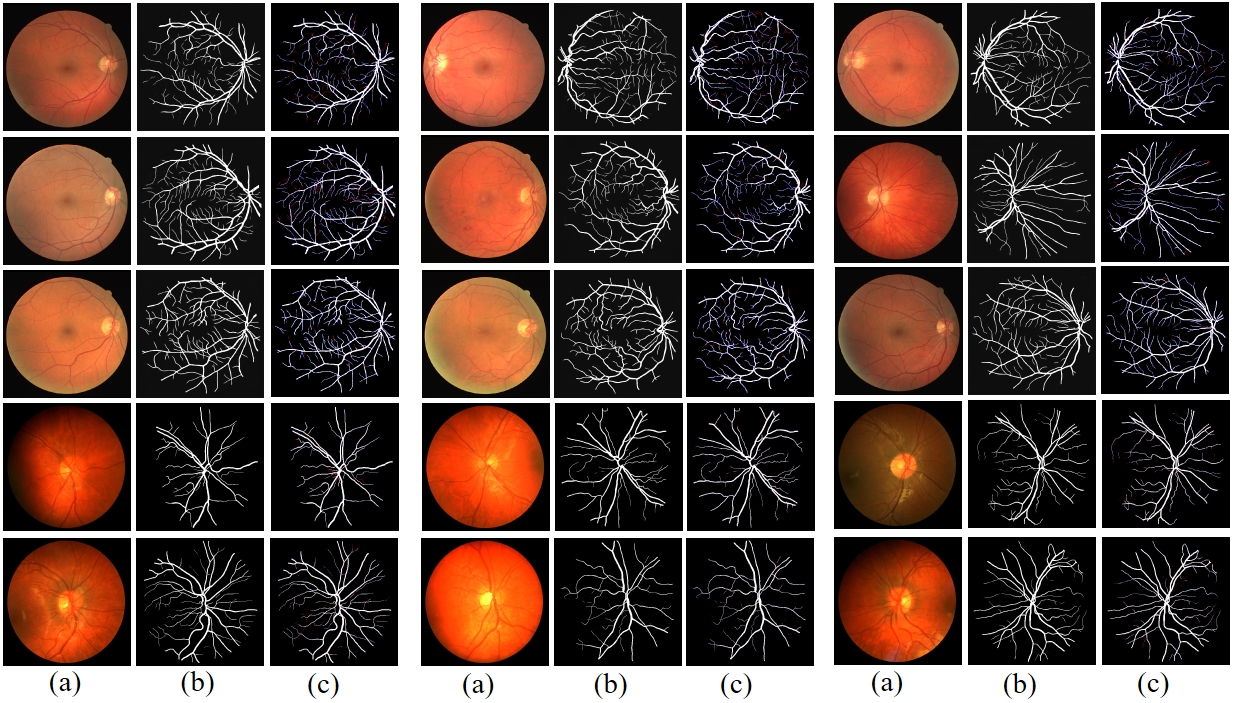
Fig. 3 Prediction results of RAMIS on retinal fundus blood vessel segmentation dataset. (a) represents the input image. (b) is the predicted result. (c) is the comparison result between the prediction result and Ground Truth, where red indicates false negatives and blue indicates false positives.
(2) RAMIS intermediate output results
We show more intermediate results of the proposed method on three different datasets in this section.
[1/3]
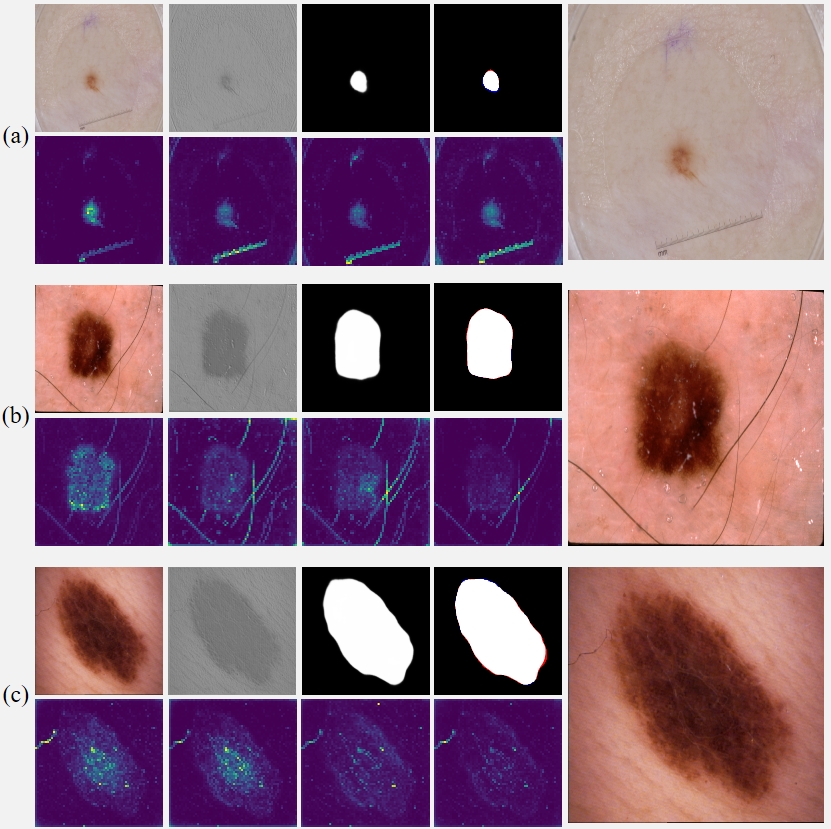
Fig. 4 Interim results of RAMIS on the skin cancer lesion dataset. (a-c) The first row in each group of pictures from left to right is the input image, initial segmentation image, final segmentation image, prediction and Ground Truth comparison results (red indicates false negatives, blue indicates false positives). All the pictures in the second row are the output results of the self-distillation module. The last picture in each group shows the results after magnifying the implicit neural expression by twice the resolution.
[2/3]
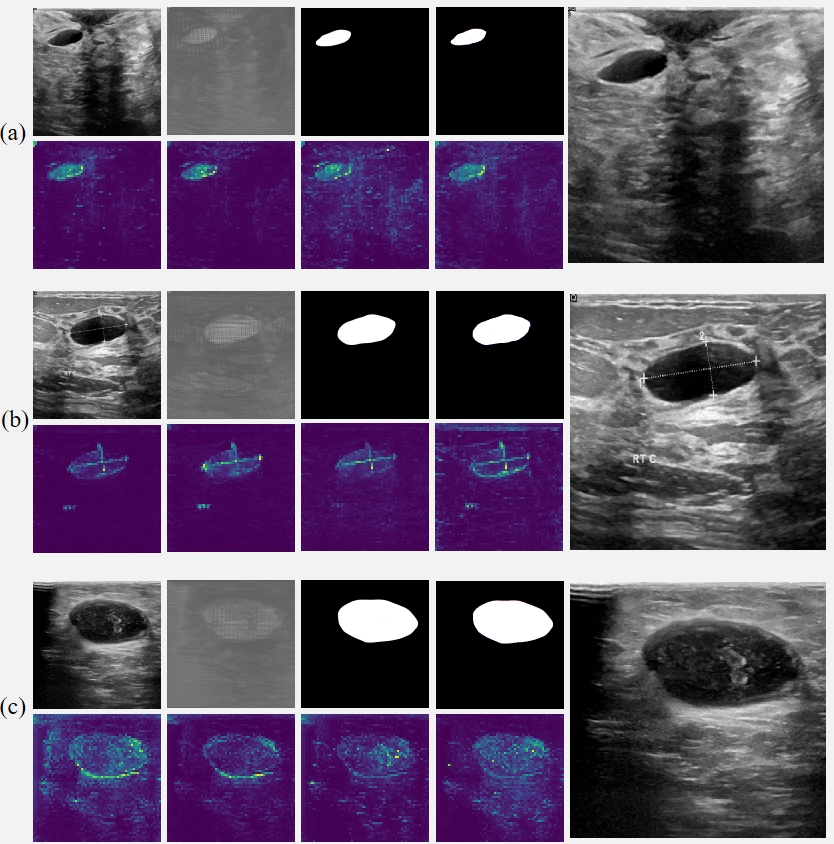
Fig. 5 Intermediate results of RAMIS on breast tumor ultrasound image segmentation dataset. (a-c) The first row in each group of pictures from left to right is the input image, initial segmentation image, final segmentation image, prediction and Ground Truth comparison results (red indicates false negatives, blue indicates false positives). All the pictures in the second row are the output results of the self-distillation module. The last picture in each group shows the results after magnifying the implicit neural expression by twice the resolution.
[3/3]
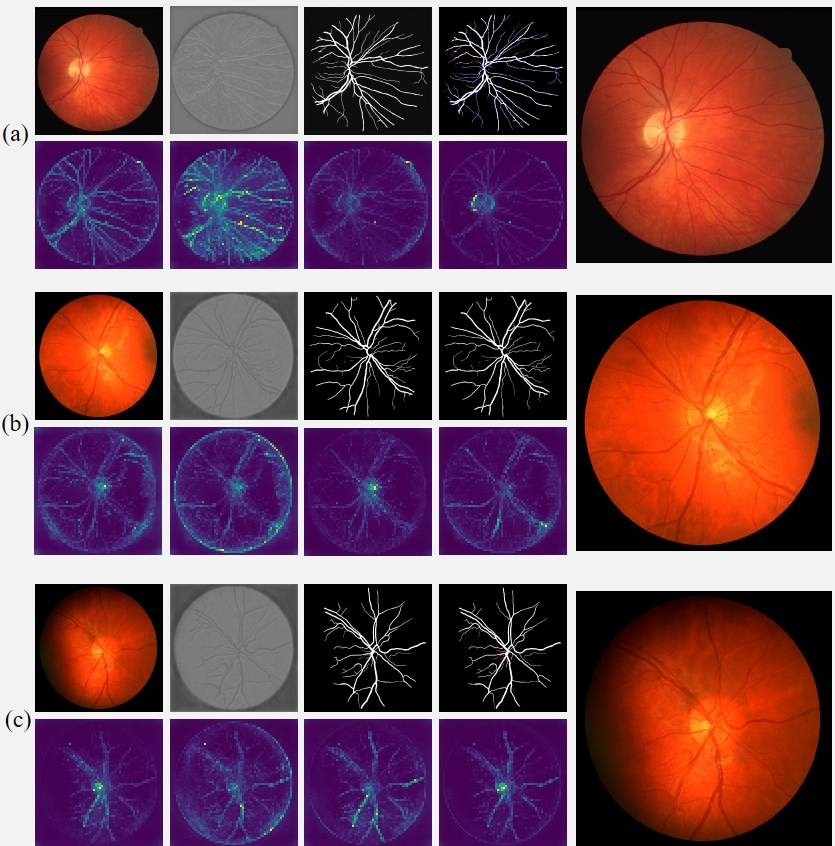
Fig. 6 Intermediate results of RAMIS on retinal fundus vessel segmentation dataset. (a-c) The first row in each group of pictures from left to right is the input image, initial segmentation image, final segmentation image, prediction and Ground Truth comparison results (red indicates false negatives, blue indicates false positives). All the pictures in the second row are the output results of the self-distillation module. The last picture in each group shows the results after magnifying the implicit neural expression by twice the resolution.
Qualitative comparison and supplementary results
In this section, we present the results of a complete qualitative comparison with previous methods and demonstrate more visual results of the RAMIS output using images from the comparison experiments as input.
[1-1 / 3]
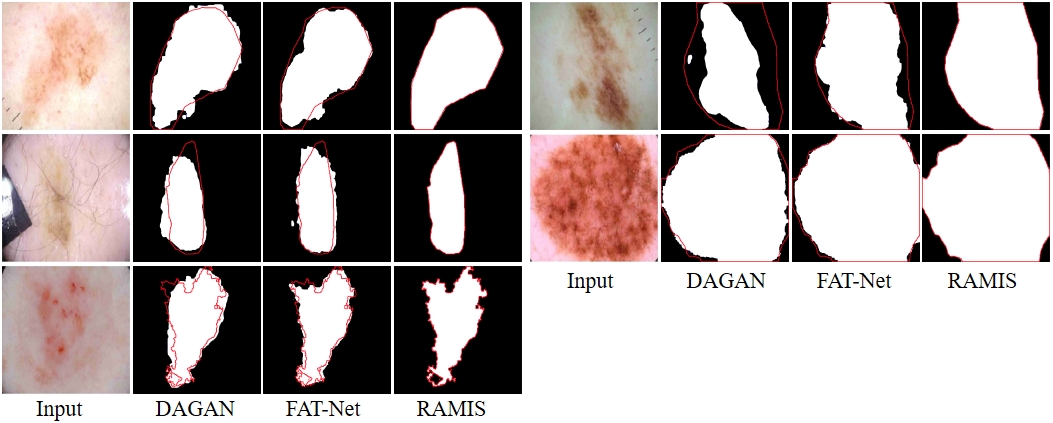
Fig. 7-1 Qualitative comparison results between RAMIS and DAGAN [1] and FAT-Net [2] on the ISIC 2018 dataset. The red outline represents Ground Truth. The prediction results of DAGAN [1] and FATNet [2] are derived from the report of FAT-Net [2].
[1-2 / 3]
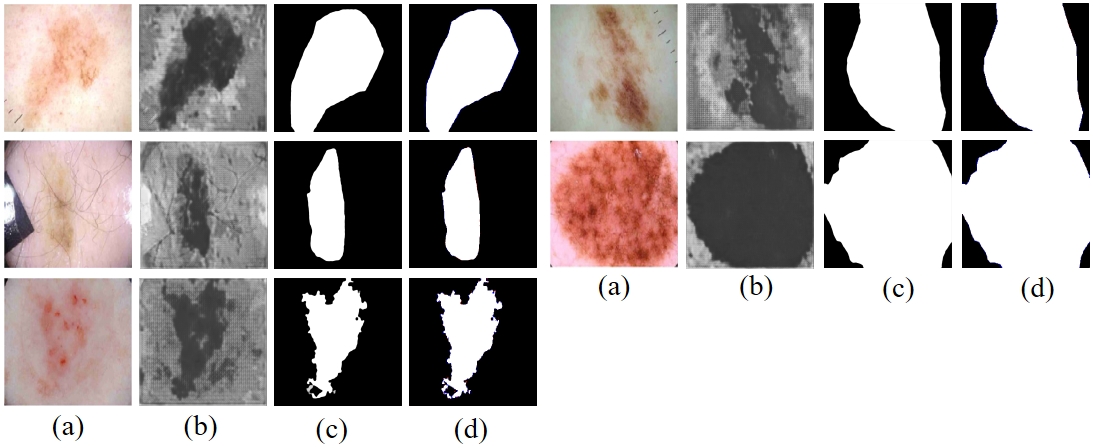
Fig. 7-2 (a) represents the input image. (b) shows the initial segmentation results. (c) shows the prediction results of the proposed method. (d) Indicates the comparison results between the predictions of the proposed method and Ground Truth (red indicates false negatives, blue indicates false positives)
[2-1 / 3]
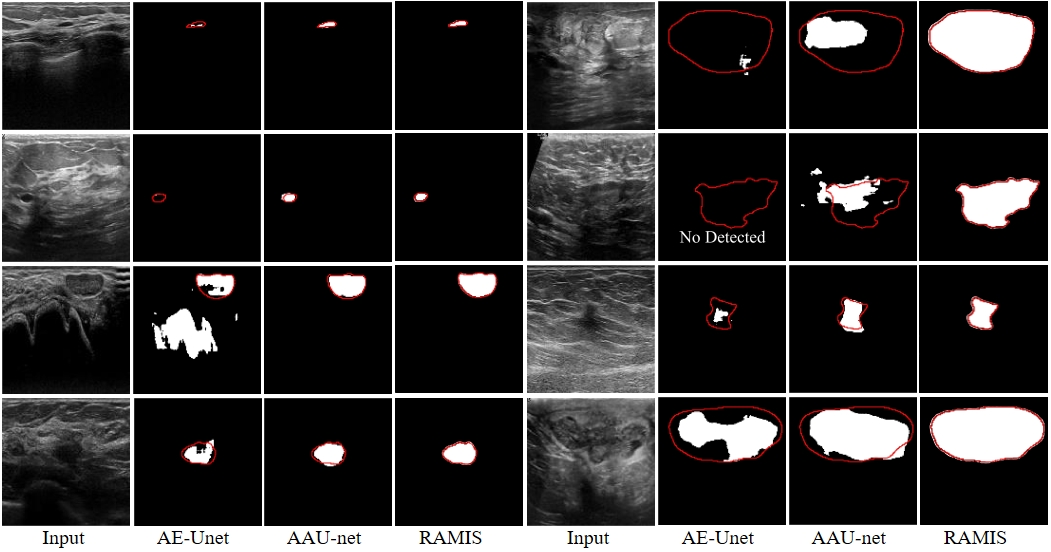
Fig. 8-1 Qualitative comparison results between RAMIS and AE-Unet [3], AAU-net [4] on the BUSI dataset. The red outline represents Ground Truth. The prediction results of AE-Unet [3] and AAU-net [4] are derived from the report of AAU-net [4].
[2-2 / 3]
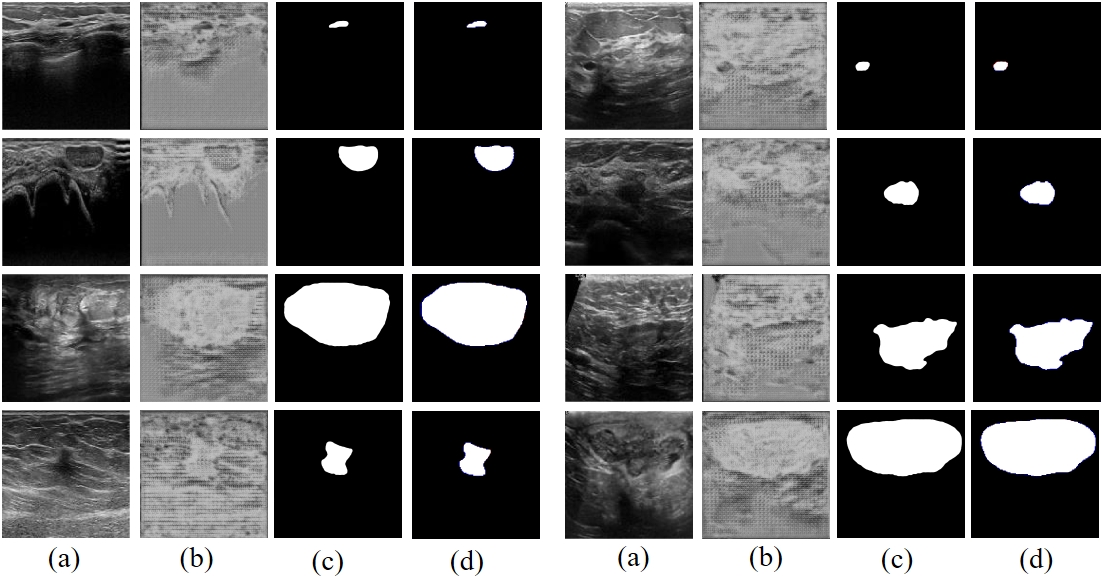
Fig. 8-2 (a) represents the input image. (b) shows the initial segmentation results. (c) shows the prediction results of the proposed method. (d) Indicates the comparison results between the predictions of the proposed method and Ground Truth (red indicates false negatives, blue indicates false positives)
[3 / 3]
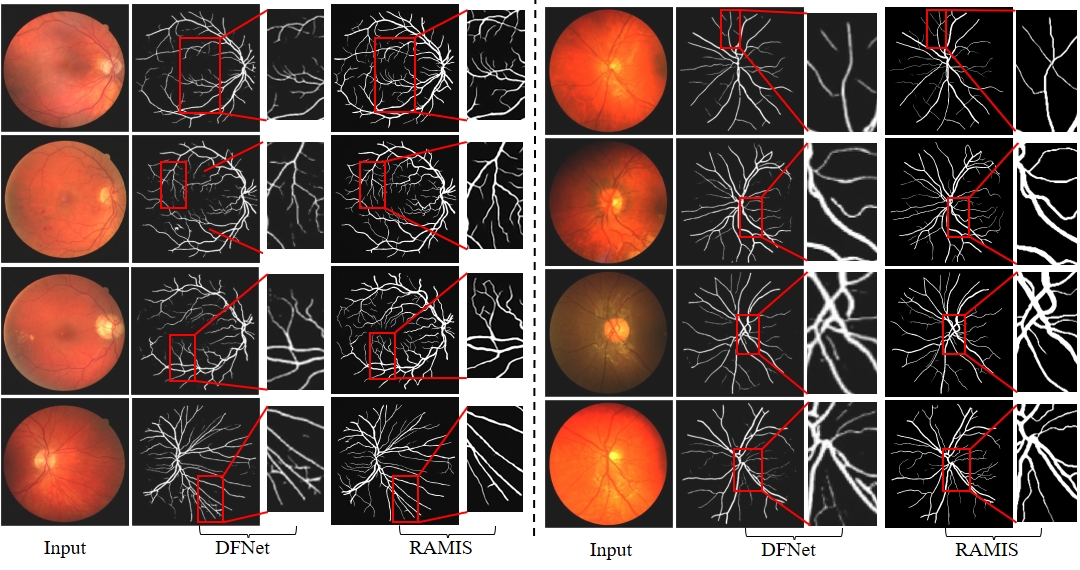
Fig. 9 Qualitative comparison results between RAMIS and DFNet [5] on the retinal fundus blood vessel segmentation dataset. The left side of the dashed line is the Drive dataset, and the right side is the Chase dataset. The prediction results of DFNet [5] are derived from their paper report.
References
[1] B. Lei, Z. Xia, F. Jiang, X. Jiang, Z. Ge, Y. Xu, J. Qin, S. Chen, T. Wang, and S. Wang, “Skin lesion segmentation via generative adversarial networks with dual discriminators,” Medical Image Analysis, vol. 64, p. 101716, 2020.
[2] H. Wu, S. Chen, G. Chen, W. Wang, B. Lei, and Z. Wen, “Fat-net: Feature adaptive transformers for automated skin lesion egmentation,”
Medical image analysis, vol. 76, p. 102327, 2022.
[4] G. Chen, L. Li, Y. Dai, J. Zhang, and M. H. Yap, “Aau-net: an adaptive attention u-net for breast lesions segmentation in ultrasound images,” IEEE Transactions on Medical Imaging, 2022.
[5] P. Yin, H. Cai, and Q. Wu, “Df-net: Deep fusion network for multi-source vessel segmentation,” Information Fusion, vol. 78, pp. 199–208, 2022.